File:Aliasing-folding.svg

From formulasearchengine
Jump to navigation Jump to search

Original file(SVG file, nominally 300 × 200 pixels, file size: 16 KB)

This file is from Wikimedia Commons and may be used by other projects. The description on its file description page there is shown below.

Summary

Description
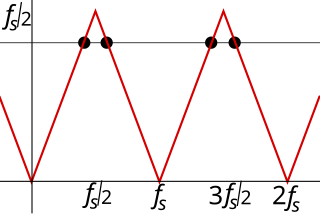
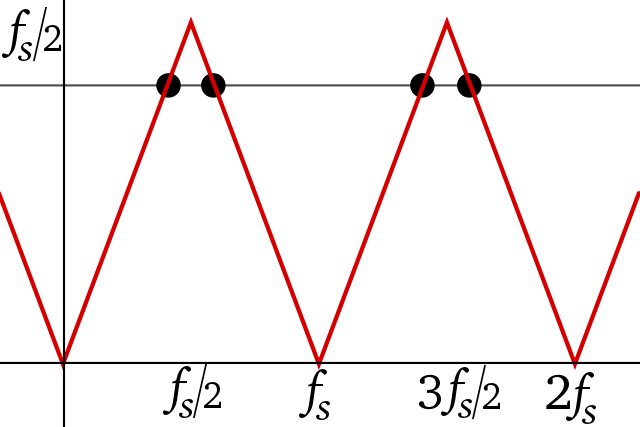
English: Graph of frequency aliasing, showing folding frequency and periodicity. Frequencies above ƒs/2 (the Nyquist frequency) have an alias below ƒs/2, whose value is given by this graph. See Spectral imaging of the atmosphere, by G. G. Shepherd, Figure 2.9(a), p. 43 for similar diagram.
Date
Source Own work
Author Nils R. Barth
Permission
(Reusing this file)
Nils R. Barth, the copyright holder of this work, hereby publishes it under the following license:
Public domain I, the copyright holder of this work, release this work into the public domain. This applies worldwide.
In some countries this may not be legally possible; if so:
I grant anyone the right to use this work for any purpose, without any conditions, unless such conditions are required by law.
SVG development
InfoField
 
The SVG code is valid.
 
This chart was created with Gnuplot.
 
This plot uses embedded text/digits.
Source code
InfoField
Gnuplot code
Source code
# Graph of aliasing frequencies
# Triangle wave

# Set terminal
set terminal svg enhanced size 300 200 fs 10
set samples 1001  # high quality
set border 31 linewidth .3 # thin border

set output "aliasing-folding.svg"

# Ranges
set xrange [-.2:2.2] # 2 cycles, with room for labels
set xtics  ( \
     "0"     0,                                        \
   "fs/4"  .25,   "fs/2"  .5,  "3fs/4"  .75,   "fs" 1, \
  "5fs/4" 1.25,  "3fs/2" 1.5,  "7fs/4" 1.75,  "2fs" 2  \
           ) # Key feature (fold) is at .5; add .25 for reference
set yrange [-.1:1.1] # Slight headroom from max of 1
set ytics ( \
   "0"  0,  "fs/4"  .5,  "fs/2" 1  \
          ) # Corresponding y values

# Zero axes and grid as guidelines, no key (self-explanatory)
set zeroaxis
set grid
unset key

###########################
# Define and plot function
###########################

tri(x) = acos(cos(2*pi*x))/pi # normalized triangle wave

plot tri(x)

Captions

Add a one-line explanation of what this file represents

Items portrayed in this file

depicts

23 April 2009

image/svg+xml

9d3d2d940c0a47c73a28d17942649d4342af3248

16,312 byte

200 pixel

300 pixel

File history

Click on a date/time to view the file as it appeared at that time.

Date/TimeThumbnailDimensionsUserComment
current15:49, 9 February 2019Thumbnail for version as of 15:49, 9 February 2019300 × 200 (16 KB)wikimediacommons>Bob KReverted to version as of 18:57, 23 April 2009 (UTC)

There are no pages that use this file.