File:BAMS climate assess boulder water vapor 2002 - 2.png

From formulasearchengine
Jump to navigation Jump to search

BAMS_climate_assess_boulder_water_vapor_2002_-_2.png(775 × 425 pixels, file size: 12 KB, MIME type: image/png)

This file is from Wikimedia Commons and may be used by other projects. The description on its file description page there is shown below.

Summary

Description
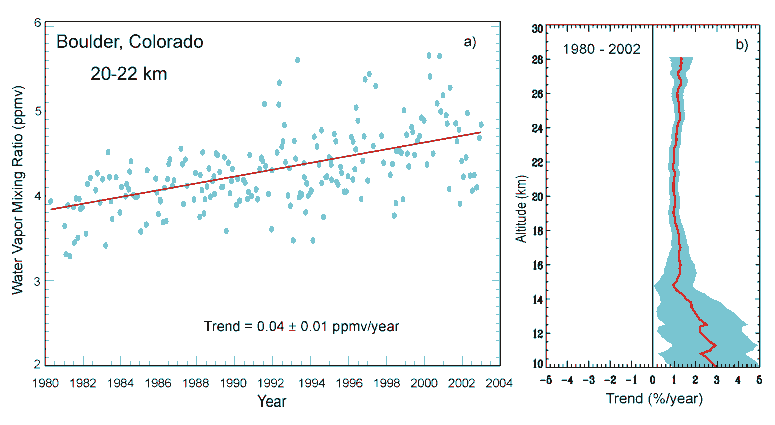
English: Stratospheric water vapor 1% increase. 30% may be due to increased methane.
  • Observations using balloon-borne frost-point hygrometers, have detected an approximately 1% per year increase in stratospheric water vapor at Boulder, Colorado, since 1980. Besides implications for climate change, increased water vapor can affect the rate of chemical ozone loss, for example, by increasing the incidence of polar stratospheric clouds. Satellite measurements of water vapor, although not of adequate length for accurate trend determination, suggest that the increase may extend to other latitudes.[1]
  • Observations have provided evidence for a widespread increase in stratospheric water vapor, which plays a role both in cooling the lower stratosphere and in depleting ozone through chemical interactions, thereby contributing to climate processes. However, the water vapor trends are not fully defined, nor are their cause understood.[2]
  • Stratospheric water vapor measurements at a single location (Boulder, Colorado, U.S., 40°N) for the period 1981-2000 show a statistically significant increase of approximately 1%/year over altitudes 15-28 km. For the shorter period 1991-2001, global satellite measurements covering latitudes 60°N-60°S show a similar trend of 0.6-0.8%/year for altitudes ~25-50 km, but no significant trend at lower altitudes. The increases in water vapor are substantially larger than can be explained by tropospheric methane trends. Characterization of stratospheric water vapor trends is limited by the lack of global long-term measurements.[3]
This graph image could be re-created using vector graphics as an SVG file. This has several advantages; see Commons:Media for cleanup for more information. If an SVG form of this image is available, please upload it and afterwards replace this template with {{vector version available|new image name}}.


It is recommended to name the SVG file “BAMS climate assess boulder water vapor 2002 - 2.svg”—then the template Vector version available (or Vva) does not need the new image name parameter.
Source http://www.cmdl.noaa.gov/hotitems/watervapor.html
Author NOAA

Licensing

Public domain
This image is in the public domain because it contains materials that originally came from the U.S. National Oceanic and Atmospheric Administration, taken or made as part of an employee's official duties.

العربية  čeština  Deutsch  Zazaki  English  español  eesti  suomi  français  hrvatski  magyar  italiano  日本語  한국어  македонски  മലയാളം  Plattdüütsch  Nederlands  polski  português  română  русский  sicilianu  slovenščina  Türkçe  Tiếng Việt  简体中文  繁體中文  +/−

Original upload log

Date/Time Dimensions User Comment
5 July 2006, 13:42:17 775 × 425 (13969 bytes) Nils Simon (talk · contribs) {{PD-USGov-DOC-NOAA}}

Captions

Add a one-line explanation of what this file represents

Items portrayed in this file

depicts

image/png

4f0a6373149a7fb43accf81a0c10445cb3c86d66

11,802 byte

425 pixel

775 pixel

File history

Click on a date/time to view the file as it appeared at that time.

Date/TimeThumbnailDimensionsUserComment
current14:21, 21 August 2014Thumbnail for version as of 14:21, 21 August 2014775 × 425 (12 KB)wikimediacommons>GifTaggerBot: Converting file to superior PNG file. (Source: BAMS_climate_assess_boulder_water_vapor_2002.gif). This GIF was problematic due to non-greyscale color table.

There are no pages that use this file.