File:Linear least squares2.png
Jump to navigation
Jump to search

Size of this preview: 499 × 599 pixels. Other resolutions: 200 × 240 pixels | 400 × 480 pixels | 889 × 1,067 pixels.
Original file (889 × 1,067 pixels, file size: 30 KB, MIME type: image/png)
Summary
| Description |
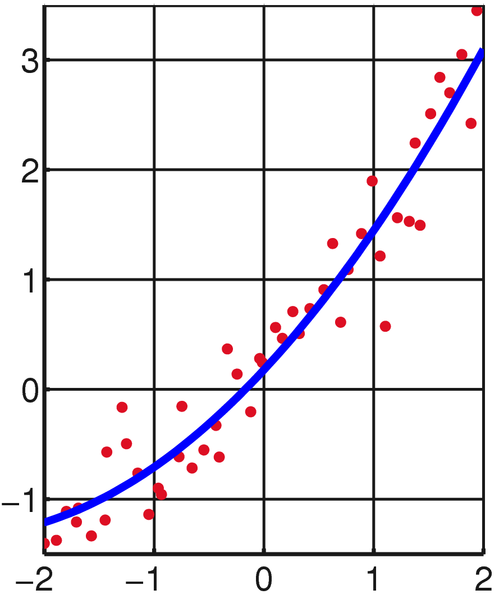
English: Illustration of linear least squares. |
|||
| Date | (UTC) | |||
| Source | self-made with MATLAB, tweaked in Inkscape. | |||
| Author | Oleg Alexandrov | |||
| Other versions |
|


This diagram was created with MATLAB.
| I, the copyright holder of this work, release this work into the public domain. This applies worldwide. In some countries this may not be legally possible; if so: I grant anyone the right to use this work for any purpose, without any conditions, unless such conditions are required by law. |
Source code (MATLAB)
% Illustration of linear least squares.
function main()

   % KSmrq's colors
   red    = [0.867 0.06 0.14];
   blue   = [0, 129, 205]/256;
   green  = [0, 200,  78]/256;
   yellow = [2764, 194,   0]/256;
   white = 0.99*[1, 1, 1];
   gray = 0.1*white;

% Set up the grid and other parameters
   N = 100;
   A = -2.2; B = 7;
   X = linspace(A, B, N);
   C=-4; D = 4;

   % Set up the figure
   lw = 5; % linewidth
   lw2 = lw/2;
   fs = 22; % font size
   figure(1); clf; hold on;
   set(gca, 'fontsize', fs);
   set(gca, 'linewidth', lw2)
   hold on; grid on;

   % random numbers
   s=0.16;
   a = 1.7; b = 3; c = 1;
   p = 1; q = 75; r = 1.3;
   M = 50;
   p = s*p; q = s*q; r = s*r;
   XX=linspace(A, B, M+1);
   YY = p+q*XX+r*XX.^2;

   Xr = 7*(1:M);
   Yr = Xr;
   for i=1:M
      rd=rand(1);
      Xr(i) = XX(i)*rd+XX(i+1)*(1-rd);
      Yr(i) = p+q*Xr(i)+r*Xr(i)^2 + 0.4*erfinv(2*rand(1) - 1);
   end

   myrad = 0.05;
   for i=1:length(Xr)
      ball(Xr(i), Yr(i), myrad, red);
   end

   axis equal;


   % least squares fitting
   Yr = Yr';
   Xr=Xr';
   Mat = [(0*Xr+1) Xr Xr.^2];
   V=Mat'*Yr;
   V=(Mat'*Mat)\V;
   pe = V(1); qe = V(2); re=V(3);

   plot(X, pe+qe*X+re*X.^2, 'b', 'linewidth', lw);

   grid on;
   set(gca, 'GridLineStyle', '-', 'xcolor', gray);
   set(gca, 'GridLineStyle', '-', 'ycolor', gray);
   set(gca, 'XTick', [-2 -1 0 1 2]);
   plot([-2 2], [3.5 3.5], 'linewidth', lw2, 'color', gray);

   axis equal;
   axis([-2, 2, -1.7, 3.5]);

   saveas(gcf, 'Linear_least_squares2.eps', 'psc2'); % save as eps
   %plot2svg('Linear_least_squares.svg'); % save as svg


function ball(x, y, r, color)
   Theta=0:0.7:2*pi;
   X=r*cos(Theta)+x;
   Y=r*sin(Theta)+y;
   H=fill(X, Y, color);
   set(H, 'EdgeColor', 'none')
File history
Click on a date/time to view the file as it appeared at that time.
| Date/Time | Thumbnail | Dimensions | User | Comment | |
|---|---|---|---|---|---|
| current | 22:10, 21 February 2009 | | 889 × 1,067 (30 KB) | wikimediacommons>Oleg Alexandrov | Normal noise, per Michael Hardy |
File usage
There are no pages that use this file.