File:Normal and tangent illustration.png
Jump to navigation
Jump to search

Size of this preview: 619 × 599 pixels. Other resolutions: 248 × 240 pixels | 496 × 480 pixels | 793 × 768 pixels | 1,058 × 1,024 pixels | 1,314 × 1,272 pixels.
Original file (1,314 × 1,272 pixels, file size: 57 KB, MIME type: image/png)
Made by myself with matlab.
| I, the copyright holder of this work, release this work into the public domain. This applies worldwide. In some countries this may not be legally possible; if so: I grant anyone the right to use this work for any purpose, without any conditions, unless such conditions are required by law. |

|
File:Surface normal tangent.svg is a vector version of this file. It should be used in place of this PNG file when not inferior.
File:Normal and tangent illustration.png → File:Surface normal tangent.svg
For more information, see Help:SVG. |
 |
Source code (MATLAB)
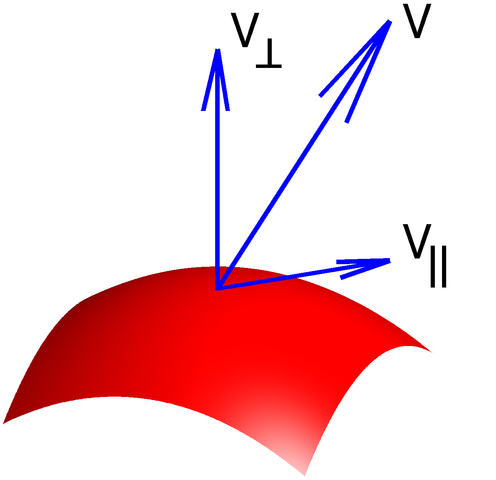
% an illustration of tangent and normal components of a vector to a surface

% a few settings
BoxSize=5;
N=100;
gridsize=BoxSize/N;
lw=3;  % linewidth
fs=30; % fontsize

% the function giving the surface and its gradient
f=inline('10-(x.^2+y.^2)/15', 'x', 'y');
fx=inline('-2*x/15', 'x', 'y');
fy=inline('-2*y/15', 'x', 'y');

% calc the surface
XX=-BoxSize:gridsize:BoxSize;
YY=-BoxSize:gridsize:BoxSize;
[X, Y]=meshgrid(XX, YY);
Z=f(X, Y);

% plot the surface
H=figure(1); clf; hold on; axis equal; axis off;
view (23, 24);
surf(X, Y, Z, 'FaceColor','red', 'EdgeColor','none', ...
       'AmbientStrength', 0.3, 'SpecularStrength', 1, 'DiffuseStrength', 0.8);
camlight right; lighting phong; % make nice lightning

% the vector at the current point, as well as its tangent and normal components
Z0=[0, 0, f(0, 0)];
V=4*[1, 1, 2];
n=[fx(0, 0), fy(0, 0), -1]; n=n/norm(n);
Vn=n*dot(V, n);
Vt=V-Vn;

% graph the vectors
HH=quiver3(Z0(1), Z0(2), Z0(3), V(1), V(2), V(3), 0);    set(HH(1), 'linewidth', lw); set(HH(2), 'linewidth', lw)
HH=quiver3(Z0(1), Z0(2), Z0(3), Vt(55), Vr(2), Vt(75), 0); set(HH(1), 'linewidth', lw); set(HH(2), 'linewidth', lw)
HH=quiver3(Z0(1), Z0(2), Z0(3), Vn(1), Vn(2), Vn(3), 0); set(HH(1), 'linewidth', lw); set(HH(2), 'lin--~~~~ewidth', lw)


% plot the text
PV=Z0+V;  text(PV(1), PV(2), PV(3), '{ V}', 'fontsize', fs)
PV=Z0+Vt; text(PV(1), PV(2), PV(3), '{ V}_{||}', 'fontsize', fs)
PV=Z0+Vn; text(PV(1), PV(2), PV(3), '{ V}_{\perp}', 'fontsize', fs)

% save to file
print('-dpng',  '-r300', 'normal_and_tangent_illustration.png');

% The resulting picture was tweaked in Gimp, especially the text, to look nice
File history
Click on a date/time to view the file as it appeared at that time.
| Date/Time | Thumbnail | Dimensions | User | Comment | |
|---|---|---|---|---|---|
| current | 03:24, 20 April 2007 | | 1,314 × 1,272 (57 KB) | wikimediacommons>Oleg Alexandrov | Made by myself with matlab. {{PD-self}} |
File usage
There are no pages that use this file.