File:Roscoe surface.svg
Jump to navigation
Jump to search

Size of this PNG preview of this SVG file: 800 × 600 pixels. Other resolutions: 320 × 240 pixels | 640 × 480 pixels | 1,024 × 768 pixels | 1,280 × 960 pixels | 2,560 × 1,920 pixels.
Original file (SVG file, nominally 1,280 × 960 pixels, file size: 765 KB)
Summary
| Description |
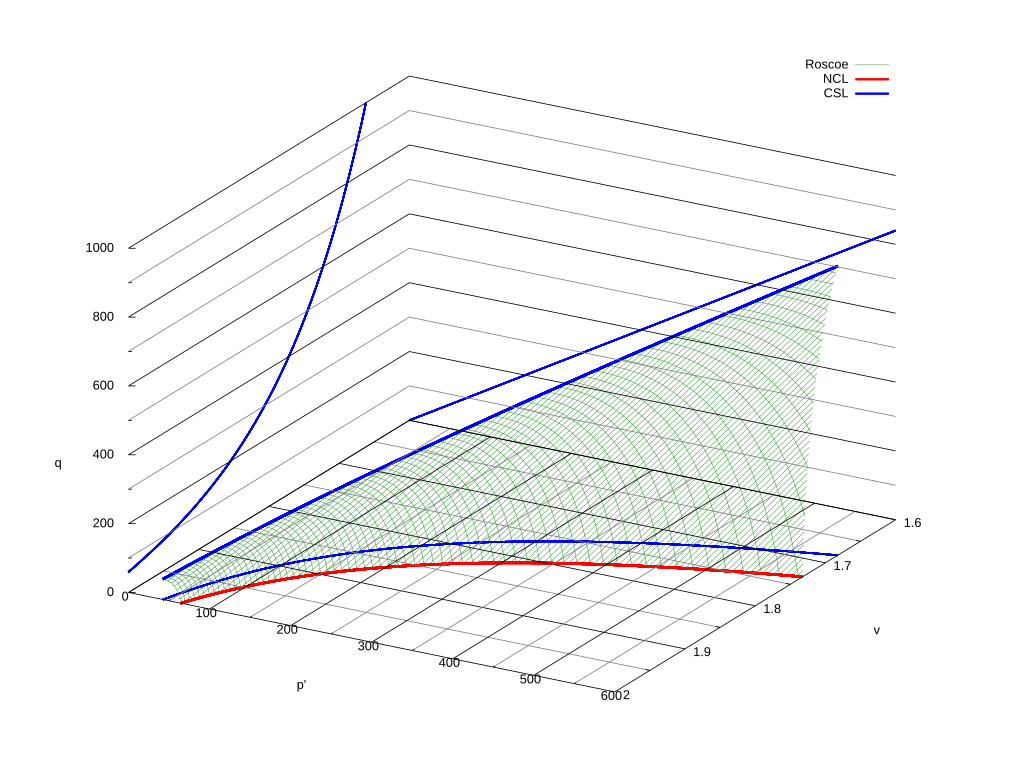
English: Roscoe Surface, plotted by Cambridge Method.
Lines on Roscoe Surface shows same line as each stress paths, which is parallel to axis p' for Consolidated Undrain(CU), non-parallel for Consolidated Drain(CD). Symbols on this figure are defined as followings.
日本語: ロスコー面(ケンブリッジ法でプロット)。
ロスコー面上の各線はそれぞれ応力径路に対応しており、p'軸に平行なものが圧密非排水(CU)、平行でないものが圧密排水(CD)。 図中の各記号は以下の通り。
|
| Date | |
| Source | Own work |
| Author | aokomoriuta(青子守歌) |
| Other versions |
|


.svg)
.svg)
.svg)
.svg)
Licensing
I, the copyright holder of this work, hereby publish it under the following licenses:
This file is licensed under the Creative Commons Attribution-Share Alike 3.0 Unported, 2.5 Generic, 2.0 Generic and 1.0 Generic license.
- You are free:
- to share – to copy, distribute and transmit the work
- to remix – to adapt the work
- Under the following conditions:
- attribution – You must give appropriate credit, provide a link to the license, and indicate if changes were made. You may do so in any reasonable manner, but not in any way that suggests the licensor endorses you or your use.
- share alike – If you remix, transform, or build upon the material, you must distribute your contributions under the same or compatible license as the original.
| This file is licensed under the Creative Commons Attribution-Noncommercial 3.0 Unported license. | |
|

|
Permission is granted to copy, distribute and/or modify this document under the terms of the GNU Free Documentation License, Version 1.2 or any later version published by the Free Software Foundation; with no Invariant Sections, no Front-Cover Texts, and no Back-Cover Texts. A copy of the license is included in the section entitled GNU Free Documentation License. |
You may select the license of your choice.
gnuplot code
English: All source code are also available same license as this file.
日本語: ソースコードはファイルと同じライセンスで利用可能です。
roscoe.plt
# parametric with p&v
set parametric
set dummy p,v

# constant
N = 2.5
lambda = 0.12
gamma = 2.45
M= 1.40

p0 = 200

#function
NCL(p) = N - lambda * log(p)        # v
NCL_p(v) = exp((N - v)/lambda)      # p

CSL1(p) = gamma - lambda * log(p)   # v
CSL2(p) = M * p                     # q
CSL3(v) = M * exp((gamma-v)/lambda) # q

CSL1_p(v) = exp((gamma - v)/lambda) # p

CSL_CU_p(p0) = p0 * exp((gamma - N)/lambda)
CSL_CU_v(p0) = NCL(p0)
CSL_CU_q(p0) = CSL2(CSL_CU_p(p0))

CSL_CD_p(p0) = 1/(1-M/3.0) * p0
CSL_CD_v(p0) = CSL1(CSL_CD_p(p0))
CSL_CD_q(p0) = CSL2(CSL_CD_p(p0))

#other constant
vtics = 0.1
ptics = 100
qtics = 200

max_v = ceil(NCL(100)     /vtics)*vtics
max_p = ceil(CSL_CD_p(300)/ptics)*ptics
max_q = ceil(CSL2(max_p)  /qtics)*qtics

min_v = int(CSL1(max_p) * 0.98 /vtics)*vtics
min_p = 0
min_q = 0

max_x1 = max_p
max_x2 = max_v

min_x1 = -1
min_x2 = min_v

#range
set urange[min_x1:max_x1] # p
set vrange[min_x2:max_x2] # v

set xrange[min_v:max_v] # p
set yrange[min_p:max_p] # v
set zrange[min_q:max_q] # q

#ticslevel
set ticslevel 0

#label
set xlabel "v"
set ylabel "p'"
set zlabel "q"

#grid
set xtics vtics nomirror
set ytics ptics nomirror
set ztics qtics nomirror
set mxtics 2
set mytics 2
set mztics 2
set grid xtics ytics ztics mxtics mytics mztics front lt -1 lw 1, lt 0 lw 1

#border
unset border

# surface settings
set isosample 100
set view 60,120,1,1

# stress path
SP_p(p0, v) = p0 + (CSL_CD_p(p0) - p0) * (v  - NCL(p0))/(CSL_CD_v(p0) - NCL(p0))
SP_v(p0, v) = (v > NCL(p0)) ? NCL(p0) : ((v < CSL_CD_v(p0))? CSL_CD_v(p0) : v)
SP_q(p0, v) = CSL_CD_q(p0) * (v - NCL(p0)) / (CSL_CD_v(p0) - NCL(p0))

# plot
splot  SP_v(p, v), SP_p(p, SP_v(p, v)), SP_q(p, SP_v(p, v)) title "Roscoe" ls 2 lw 0.5, \
           NCL(p), p,       0 title "NCL" ls 1 lw 3, \
          CSL1(p), p,       0 notitle     ls 3 lw 2, \
            min_v, p, CSL2(p) notitle     ls 3 lw 2, \
                v, 0, CSL3(v) notitle     ls 3 lw 2, \
          CSL1(p), p, CSL2(p) title "CSL" ls 3 lw 3

# create gif

theta = 0
set terminal gif notransparent size 1280, 960 font "Times New Roman"

load "roscoe_loop.plt"

set output
set terminal wxt
roscoe_loop.plt
set view 60,theta,1,1

set output sprintf("roscoe%3d.gif", theta)

replot

theta = theta + 5
if(theta<360) reread
File history
Click on a date/time to view the file as it appeared at that time.
| Date/Time | Thumbnail | Dimensions | User | Comment | |
|---|---|---|---|---|---|
| current | 14:20, 20 April 2011 | | 1,280 × 960 (765 KB) | wikimediacommons>青子守歌 | == {{int:filedesc}} == {{User:青子守歌/own work/information|File=Figures |en=Roscoe Surface, plotted by Cambridge Method. Lines on Roscoe Surface shows same line as each stress paths, which is parallel to axis p' for Consolidated Undrain(CU), non-para |
File usage
There are no pages that use this file.