File:Standard deviation diagram.svg
Jump to navigation
Jump to search

Size of this PNG preview of this SVG file: 400 × 200 pixels. Other resolutions: 320 × 160 pixels | 640 × 320 pixels | 1,024 × 512 pixels | 1,280 × 640 pixels | 2,560 × 1,280 pixels.
Original file (SVG file, nominally 400 × 200 pixels, file size: 17 KB)
Summary
| Description |
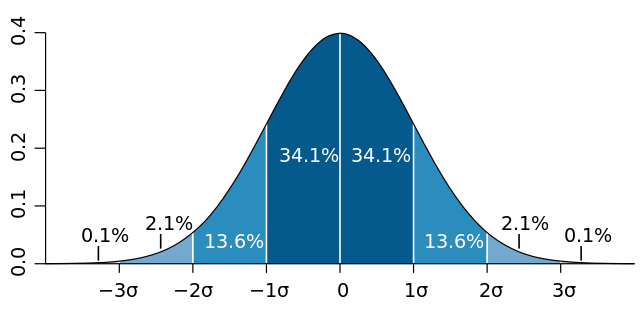
English: Normal distribution curve that illustrates standard deviations. Each band has 1 standard deviation, and the labels indicate the approximate proportion of area (note: these add up to 99.8%, and not 100% because of rounding for presentation.)
Français : Courbe de distribution normale montrant l'écart type. Chaque bande verticale a une largeur d'un écart type et les pourcentages indiquent leur valeur approximative rapportée à la population totale. Note : du fait des arrondis, le total est de 99,8 % au lieu de 100%. |
| Date | |
| Source | Own work, based (in concept) on figure by Jeremy Kemp, on 2005-02-09 |
| Author | M. W. Toews |
| Other versions |
|
.svg)
Licensing
This file is licensed under the Creative Commons Attribution 2.5 Generic license.
- You are free:
- to share – to copy, distribute and transmit the work
- to remix – to adapt the work
- Under the following conditions:
- attribution – You must give appropriate credit, provide a link to the license, and indicate if changes were made. You may do so in any reasonable manner, but not in any way that suggests the licensor endorses you or your use.
File history
Click on a date/time to view the file as it appeared at that time.
| Date/Time | Thumbnail | Dimensions | User | Comment | |
|---|---|---|---|---|---|
| current | 04:06, 15 January 2015 | | 400 × 200 (17 KB) | wikimediacommons>GliderMaven | Average is now zero not mu |
File usage
The following page uses this file: