File:World total primary energy production chart only.png
Jump to navigation
Jump to search

Size of this preview: 663 × 600 pixels. Other resolutions: 265 × 240 pixels | 531 × 480 pixels | 785 × 710 pixels.
Original file (785 × 710 pixels, file size: 29 KB, MIME type: image/png)

|
This chart image could be re-created using vector graphics as an SVG file. This has several advantages; see Commons:Media for cleanup for more information. If an SVG form of this image is available, please upload it and afterwards replace this template with
{{vector version available|new image name}}.
It is recommended to name the SVG file “World total primary energy production chart only.svg”—then the template Vector version available (or Vva) does not need the new image name parameter. |
Summary
| Description |
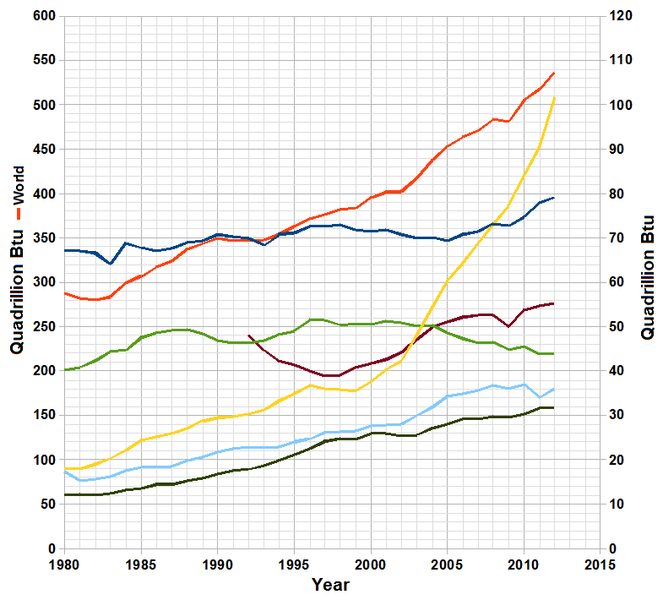
English: World total primary energy production in quadrillion Btu. Note: world total on left y-axis, while regional figures are shonw on right y-axis (approx. figures in parenthesis for 2010 and 2011, respectively).
World (510)
China (97)
United States (78)
Russia (56)
Europe (45)
Africa (37)
Central and South America (30) |
| Date | |
| Source |
|
| Author | Delphi234 |
| Other versions |
 |
Licensing
| I, the copyright holder of this work, release this work into the public domain. This applies worldwide. In some countries this may not be legally possible; if so: I grant anyone the right to use this work for any purpose, without any conditions, unless such conditions are required by law. |
File history
Click on a date/time to view the file as it appeared at that time.
| Date/Time | Thumbnail | Dimensions | User | Comment | |
|---|---|---|---|---|---|
| current | 19:03, 28 February 2016 | | 785 × 710 (29 KB) | wikimediacommons>Delphi234 | update |
File usage
The following page uses this file: