File:Associated Legendre Poly.svg

From formulasearchengine
Jump to navigation Jump to search

Original file(SVG file, nominally 540 × 360 pixels, file size: 48 KB)

This file is from Wikimedia Commons and may be used by other projects. The description on its file description page there is shown below.

Summary

Description
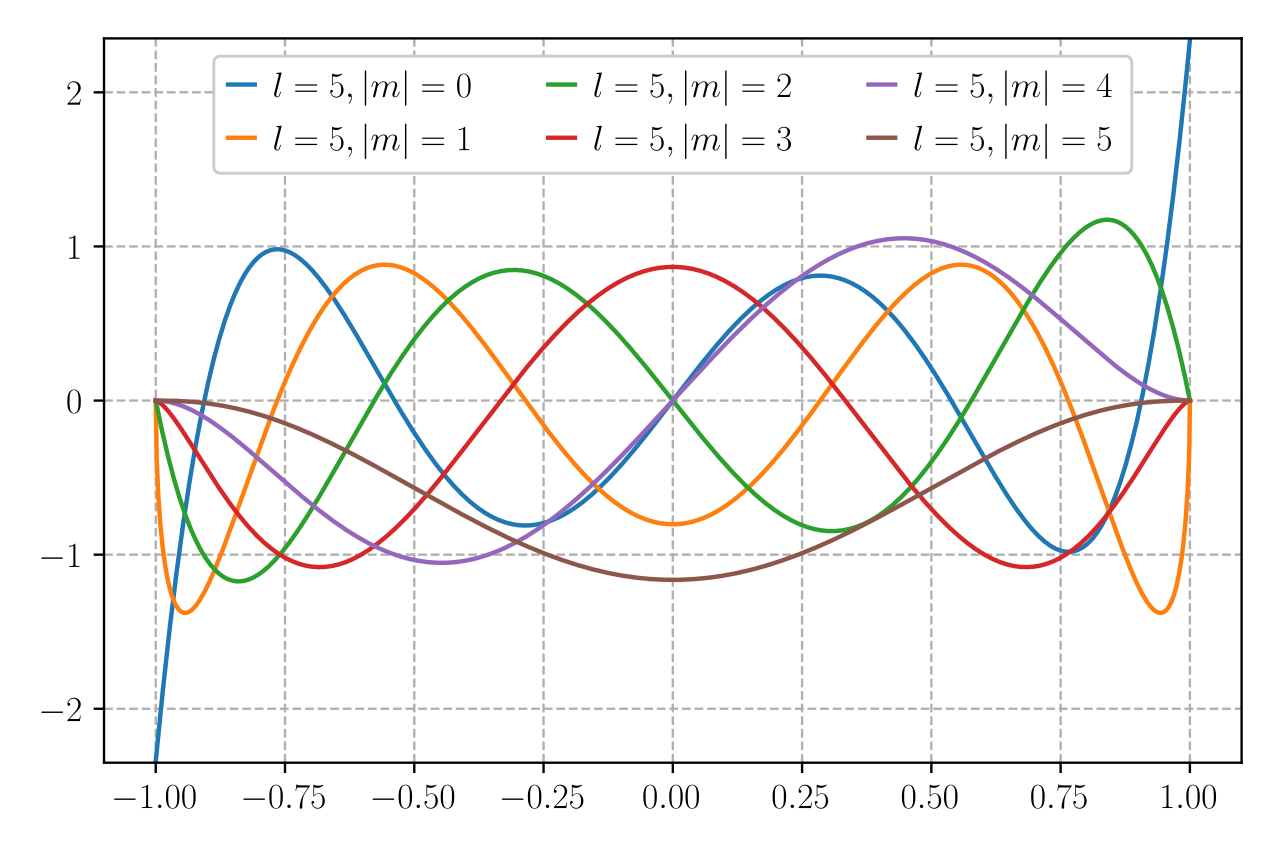
English: Curves of Associated Legendre function. The functions are normalized, i.e. what is plotted is
Date
Source Own work
Author Krishnavedala
SVG development
InfoField
 
The SVG code is valid.
 
This plot was created with Matplotlib.
Source code
InfoField

Python code

Source code
#include    <stdio.h>
#include    <stdlib.h>
#include    <math.h>
#include    <unistd.h>
#include    <gsl/gsl_sf_legendre.h>
#include    <plplot/plplot.h>

#ifndef PI
#define PI    3.1415926535897932384
#endif

#define		modulus(a)		(a > 0 ? a : -a)

typedef struct quant_num
{
	int l, m, n;
} quant_num;

const long unsigned int NUM_PTS = 5000;
const PLINT XMAX = 1;
const PLINT YMAX = 1;

void aLegendre(PLFLT *x, PLFLT *y, quant_num *numbers)
{
	long unsigned int i = 0;
	float step = 2.0/NUM_PTS, t = -1.0;
	
	while(t < 1.0 && i < NUM_PTS)
	{
		x[i] = (PLFLT)t;
		y[i] = (PLFLT)gsl_sf_legendre_sphPlm(numbers->l, abs(numbers->m), (const double)t);
		i++;
		t += step;
	}
}

void drawlegend(int n)
{
	PLINT 	nLegend = n+1;
	char 	*text[nLegend];
	int i;
	PLINT	opt_array[nLegend];
	PLINT	text_colors[nLegend];
	PLINT	line_colors[nLegend];
	PLINT	line_styles[nLegend];
	PLINT	line_widths[nLegend];
	PLINT 	symbol_numbers[nLegend];
	PLINT 	symbol_colors[nLegend];
	PLINT 	symbols[nLegend];
	PLFLT	symbol_scales[nLegend];
	PLINT	box_colors[nLegend] = {15};
	
	symbol_numbers[n] = n;
	symbol_colors[n] = n;
	symbols[n] 		 = '.';
	symbol_scales[n] = 1.;
	
	for(i = 0; i <= n; i++)
	{
		text[i] = malloc(15 * sizeof(char));
		if(i>0)
			sprintf(text[i], "l=5, &#124;m&#124;=%d",i);
		else
			sprintf(text[i], "l=5, m=%d",i);
		line_colors[i]	= i+1;
		line_styles[i]	= 1;
		line_widths[i]	= 1;
		text_colors[i] 	= 15;
		opt_array[i] 	= PL_LEGEND_LINE;
	}
	
	pllegend(0, 0.72, .87, .05, 15,
		nLegend, opt_array, 0.5, 0.7, 1.5, 0,
		text_colors, (const char**) text, 
		box_colors, NULL, NULL, 
		line_colors, line_styles, line_widths,
		symbol_colors, symbol_scales, symbol_numbers, symbols);
	for(i = 0; i <= n; i++)
		free(text[i]);
}

int main(void)
{
    PLFLT X[NUM_PTS], Y[NUM_PTS];
    quant_num test_num[6];
    int i;
	
    plscol0(0, 255, 255, 255);
    plinit();
    plscol0(15, 0, 0, 0);
    plcol(15);
    plenv(-XMAX,XMAX, -YMAX,YMAX, 0, 2);

    pllab("x", "P#dl#u#um#d(x)", "Associated Legendre Polynomials");
    plbox( "bcnst", 0, 0, "bcnstv", 0, 0);    plcol(1);
    for(i = 0; i <= 5; i++)
    {
		test_num[i].l = 5; 	test_num[i].m = i; 	test_num[i].n = 1; 
		orbital(X, Y, &test_num[i]); plcol(i+1);
		plline(NUM_PTS, X, Y);
    }

    drawlegend(test_num[0].l);
    
    plend();

    return 0;
}

Data

Source code
import matplotlib.pyplot as plt
from scipy.special import lpmv
import numpy as np
plt.rc('svg', fonttype='none')
plt.rc('text', usetex=1)

dt = 1e-3
l = 5
x = np.arange(-1, 1, dt)
y = []
for m in range(l+1):
    y.append(lpmv(m, l, x))
    
fig, ax = plt.subplots(1,1, figsize=(10,6))
for m in range(l+1):
    ax.plot(x, y[m] / np.linalg.norm(y[m]), label=r'$l=%d, &#124;m&#124;=%d$' % (l, m))
ax.grid(True)
ax.legend()
ax.minorticks_on()
ax.set_xlim([-1,1])
ax.set_xlabel(r'$x$')
ax.set_ylabel(r'$P_l^m(x)$')
fig.savefig('legendre.svg', bbox_inches='tight')

Licensing

I, the copyright holder of this work, hereby publish it under the following licenses:
w:en:Creative Commons
attribution share alike
This file is licensed under the Creative Commons Attribution-Share Alike 3.0 Unported license.
You are free:
  • to share – to copy, distribute and transmit the work
  • to remix – to adapt the work
Under the following conditions:
  • attribution – You must give appropriate credit, provide a link to the license, and indicate if changes were made. You may do so in any reasonable manner, but not in any way that suggests the licensor endorses you or your use.
  • share alike – If you remix, transform, or build upon the material, you must distribute your contributions under the same or compatible license as the original.
GNU head Permission is granted to copy, distribute and/or modify this document under the terms of the GNU Free Documentation License, Version 1.2 or any later version published by the Free Software Foundation; with no Invariant Sections, no Front-Cover Texts, and no Back-Cover Texts. A copy of the license is included in the section entitled GNU Free Documentation License.
You may select the license of your choice.

Captions

Add a one-line explanation of what this file represents

Items portrayed in this file

depicts

25 November 2010

image/svg+xml

16ecdc42e0ba939e12c1f09283ede01be5608034

49,502 byte

360 pixel

540 pixel

File history

Click on a date/time to view the file as it appeared at that time.

Date/TimeThumbnailDimensionsUserComment
current22:38, 3 December 2020Thumbnail for version as of 22:38, 3 December 2020540 × 360 (48 KB)wikimediacommons>AkanoToEAdjusted normalization, legend formatting, and text formatting

There are no pages that use this file.