File:KaiserWindow.jpg
Jump to navigation
Jump to search
Size of this preview: 497 × 430 pixels. Other resolution: 277 × 240 pixels.
Original file (497 × 430 pixels, file size: 142 KB, MIME type: image/jpeg)

|
File:KaiserWindow.svg is a vector version of this file. It should be used in place of this JPG file.
File:KaiserWindow.jpg → File:KaiserWindow.svg
For more information, see Help:SVG. |
 |


| Description |
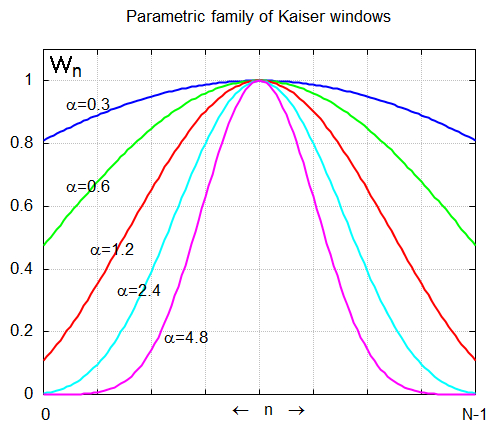
English: Kaiser Window Function for different alpha values. |
||
| Date | |||
| Source | Own work | ||
| Author | Bob K | ||
| Permission (Reusing this file) |
|
||
| Source code | Matlabgraphics_toolkit gnuplot
N = 129;
M = N-1;
n = 0:M;
figure
hold on
title('Parametric family of Kaiser windows')
alpha = 0.3;
w = besseli(0,pi*alpha*sqrt(1-(2*n/M -1).^2))/besseli(0,pi*alpha);
plot(0:N-1, w, 'color', 'blue', 'linewidth', 2)
text(7, .92, '\alpha=0.3')
ylabel(' ') % create left margin
text(2, 1.05, 'W_n', 'fontsize', 14)
text(56, -0.05, '\leftarrow n \rightarrow')
xlim([0 M])
ylim([0 1.1])
grid on
set(gca,'XTick', [0 : 1/8 : 1]*M)
set(gca,'XTickLabel',[' 0'; ' '; ' '; ' '; ' '; ' '; ' '; ' '; 'N-1 '])
alpha = 0.6;
w = besseli(0,pi*alpha*sqrt(1-(2*n/M -1).^2))/besseli(0,pi*alpha);
plot(0:N-1, w, 'color', 'green', 'linewidth', 2)
text(7, .66, '\alpha=0.6')
alpha = 1.2;
w = besseli(0,pi*alpha*sqrt(1-(2*n/M -1).^2))/besseli(0,pi*alpha);
plot(0:N-1, w, 'color', 'red', 'linewidth', 2)
text(14, .46, '\alpha=1.2')
alpha = 2.4;
w = besseli(0,pi*alpha*sqrt(1-(2*n/M -1).^2))/besseli(0,pi*alpha);
plot(0:N-1, w, 'color', 'cyan', 'linewidth', 2)
text(22, .33, '\alpha=2.4')
alpha = 4.8;
w = besseli(0,pi*alpha*sqrt(1-(2*n/M -1).^2))/besseli(0,pi*alpha);
plot(0:N-1, w, 'color', 'magenta', 'linewidth', 2)
text(36, .18, '\alpha=4.8')
hold off
| ||
| Source code | SVG code
|
Original upload log
The 4/28/2009 version is a derivative work of the following image:
- File:KaiserWindow.svg licensed with PD-self
- 2007-09-18T22:09:25Z RetoGalli 560x420 (30091 Bytes) {{Information |Description=Kaiser Window Function for different alpha values |Source=self-made with Matlab |Date=18-September-2007 |Author= [[User:RetoGalli|RetoGalli]] }}
Uploaded with derivativeFX
File history
Click on a date/time to view the file as it appeared at that time.
| Date/Time | Thumbnail | Dimensions | User | Comment | |
|---|---|---|---|---|---|
| current | 20:37, 26 February 2013 | | 497 × 430 (142 KB) | wikimediacommons>Bob K | Add Octave script. Replace legend with individual labels on each trace. |
File usage
There are no pages that use this file.