File:Lagrange points2.svg
Jump to navigation
Jump to search

Size of this PNG preview of this SVG file: 704 × 600 pixels. Other resolutions: 282 × 240 pixels | 563 × 480 pixels | 901 × 768 pixels | 1,202 × 1,024 pixels | 2,403 × 2,048 pixels | 1,083 × 923 pixels.
Original file (SVG file, nominally 1,083 × 923 pixels, file size: 104 KB)
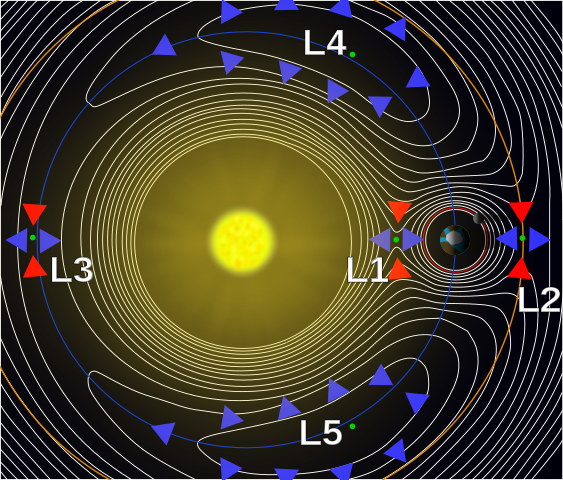
| Description | A contour plot of the effective potential of a two-body system. (the Sun and Earth here), showing the 5 Lagrange points. |
| Date | (UTC) |
| Source | |
| Author |
|
| Other versions | Image:Lagrange points.svg - incomplete SVG Gnuplot replacement. |
| This is a retouched picture, which means that it has been digitally altered from its original version. Modifications: transformed into svg. The original can be viewed here: Lagrange points.jpg:
|
W3C-validity not checked.
This file is licensed under the Creative Commons Attribution 3.0 Unported license.
- You are free:
- to share – to copy, distribute and transmit the work
- to remix – to adapt the work
- Under the following conditions:
- attribution – You must give appropriate credit, provide a link to the license, and indicate if changes were made. You may do so in any reasonable manner, but not in any way that suggests the licensor endorses you or your use.
Original upload log
This image is a derivative work of the following images:
- File:Lagrange_points.jpg licensed with PD-USGov-NASA
Uploaded with derivativeFX
File history
Click on a date/time to view the file as it appeared at that time.
| Date/Time | Thumbnail | Dimensions | User | Comment | |
|---|---|---|---|---|---|
| current | 23:47, 12 August 2009 | | 1,083 × 923 (104 KB) | wikimediacommons>Xander89 | {{Information |Description=A contour plot of the effective potential of a two-body system. (the Sun and Earth here), showing the 5 '''Lagrange points'''. An object in free-fall would trac |
File usage
There are no pages that use this file.