File:Spectral effects of decimation compared on 3 popular frequency scale conventions.pdf
Jump to navigation
Jump to search

Size of this JPG preview of this PDF file: 720 × 600 pixels. Other resolutions: 288 × 240 pixels | 576 × 480 pixels | 922 × 768 pixels | 1,229 × 1,024 pixels | 1,800 × 1,500 pixels.
Original file (1,800 × 1,500 pixels, file size: 26 KB, MIME type: application/pdf)
Summary
| Description |
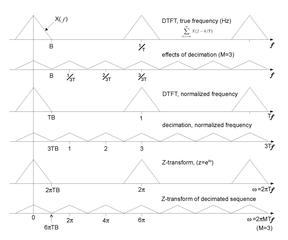
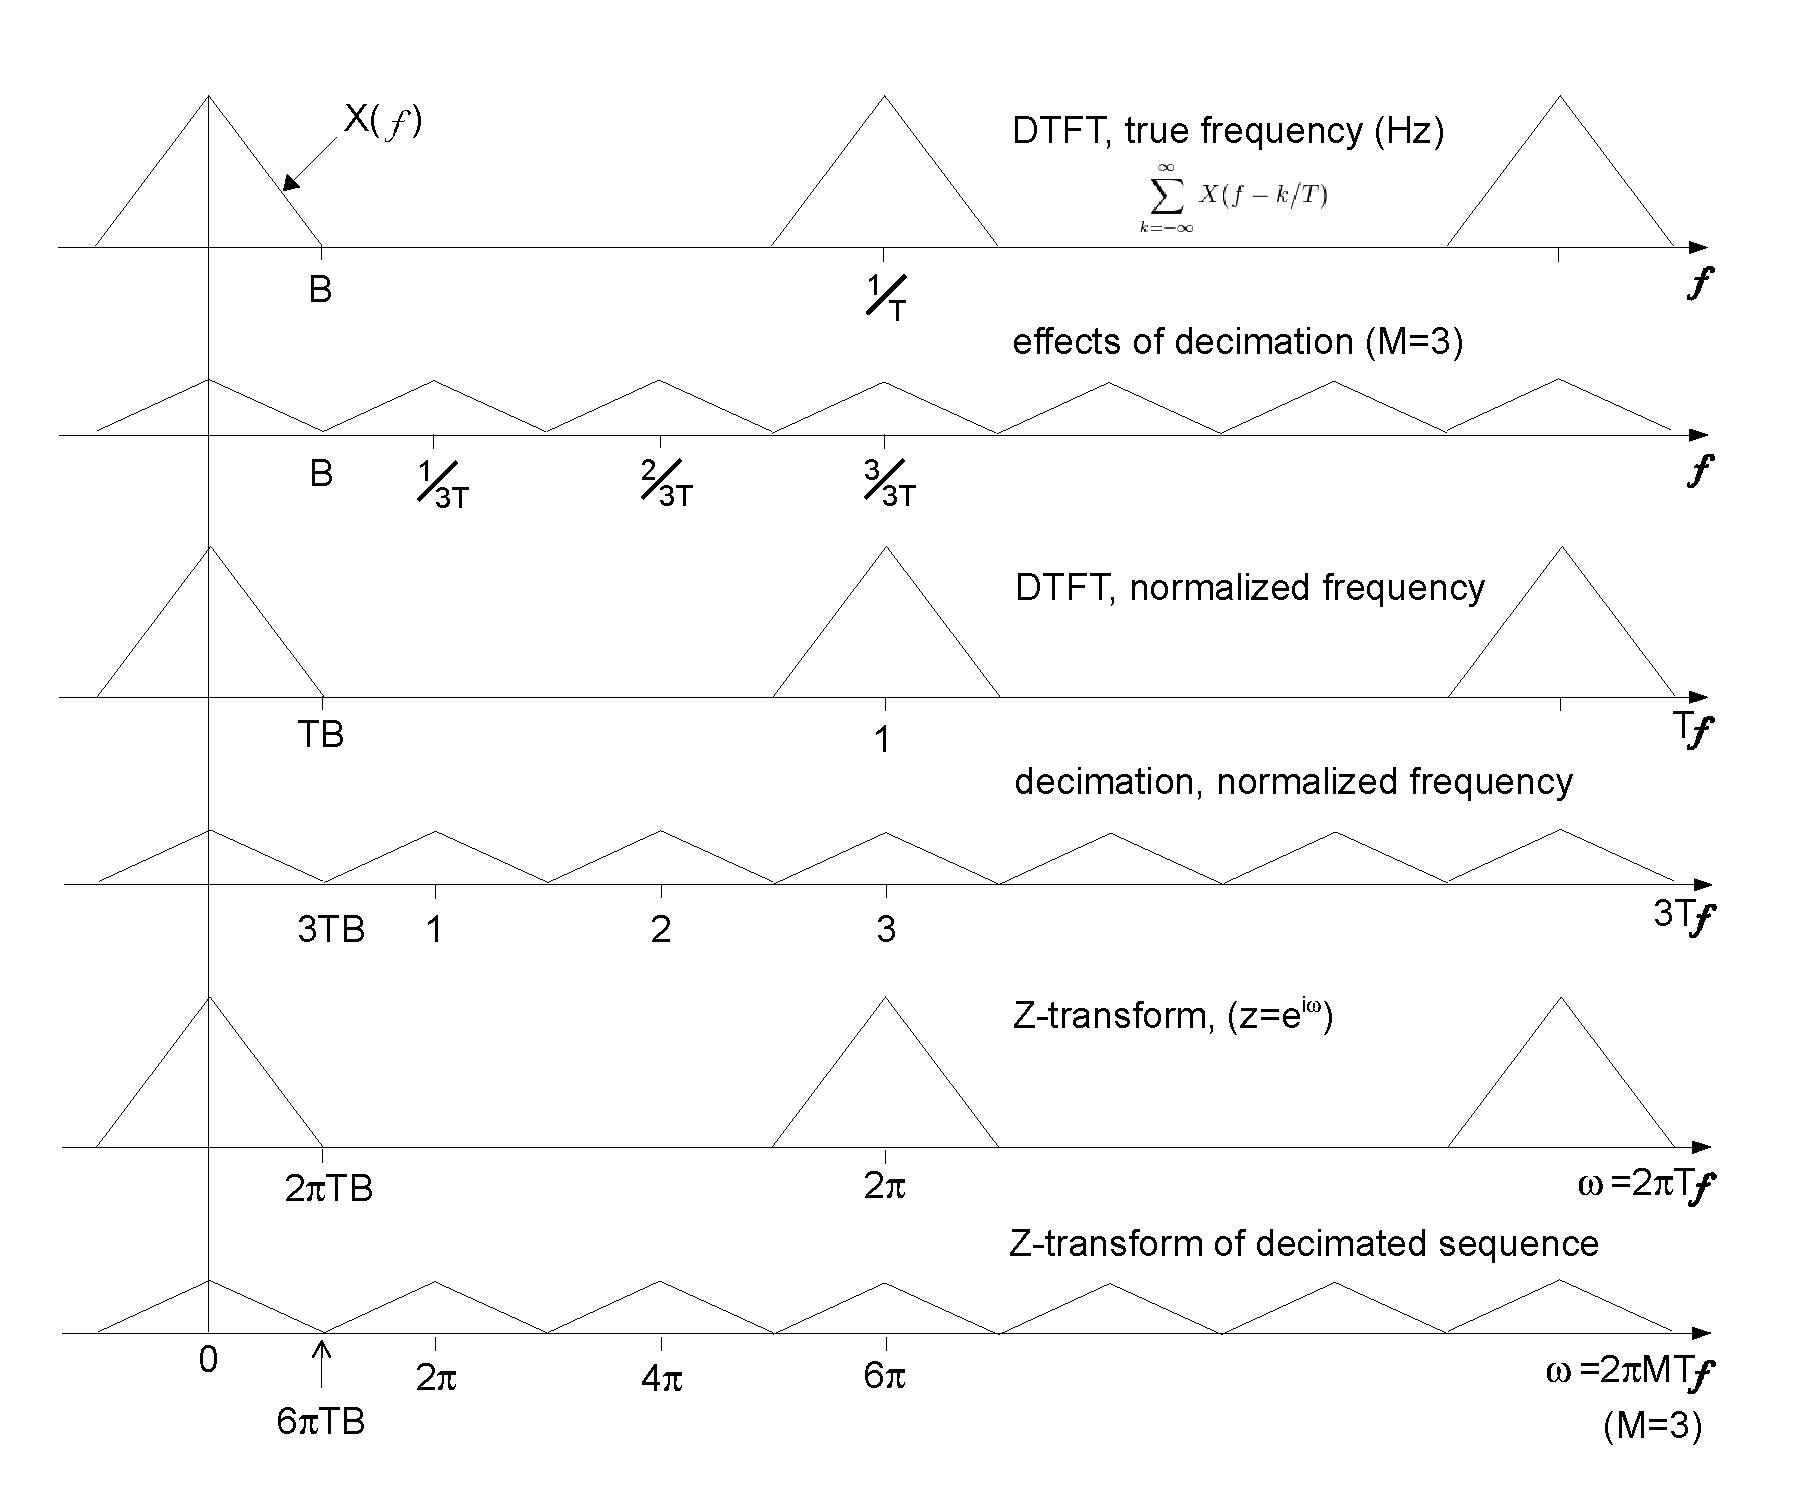
English: Each of 3 pairs of graphs depicts the spectral distributions of an oversampled function and the same function sampled at 1/3 the original rate. The bandwidth, B, in this example is just small enough that the slower sampling does not cause overlap (aliasing). The top pair of graphs represent the discrete-time Fourier transform (DTFT) representation. The middle pair, depict a normalized frequency scale, preferred by many filter design programs. The frequency, f, in Hz is divided by the sample-rate. The periodicity and Nyquist frequency are then represented by constants, 1 and 1/2 respectively. The bottom pair depict a different normalized frequency scale, used by the Z-transform... the periodicity and Nyquist frequency are respectively represented by 2π and π. |
|||
| Date | ||||
| Source | Own work. The first two graphs correspond to the top and bottom graphs of Harris[1], Figure 2.10 | |||
| Author | Bob K | |||
| Permission (Reusing this file) |
I, the copyright holder of this work, hereby publish it under the following license:
|
|||
| Other versions | Derivative works of this file: Spectral effects of decimation.pdf | |||
| References |
|
File history
Click on a date/time to view the file as it appeared at that time.
| Date/Time | Thumbnail | Dimensions | User | Comment | |
|---|---|---|---|---|---|
| current | 18:34, 19 January 2014 |  | 1,800 × 1,500 (26 KB) | wikimediacommons>Bob K | rescale 4th graph |
File usage
There are no pages that use this file.